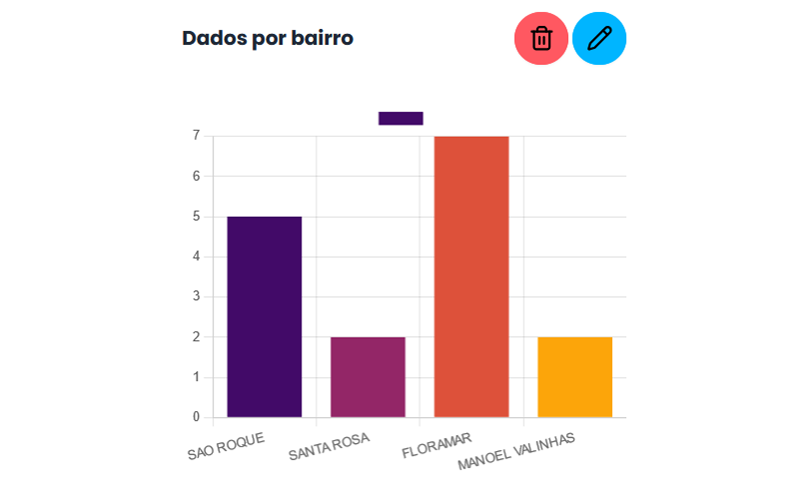
Graphics
Create bar charts, line charts, pie charts and much more according to the data on your map.
Experts and Geographers
We have a team of experts and geographers to help you create customized maps.
Multilayer maps
Request the creation of a customized map with several layers.
First step
Convert your Excel spreadsheets into CSV files, ensuring compatibility and making it easier to use your data.
Second step
Upload your CSV files to CrossGeo and the data will be coded, making them ready for analysis and visualization geographic.
Third step
With your data in CSV, choose the types of graphs and configure them to visualize and analyze exactly what you need. need.
Fourth step
Delve deeper into insights. With customized graphs at the ready, explore your data to make informed decisions and identify important trends.
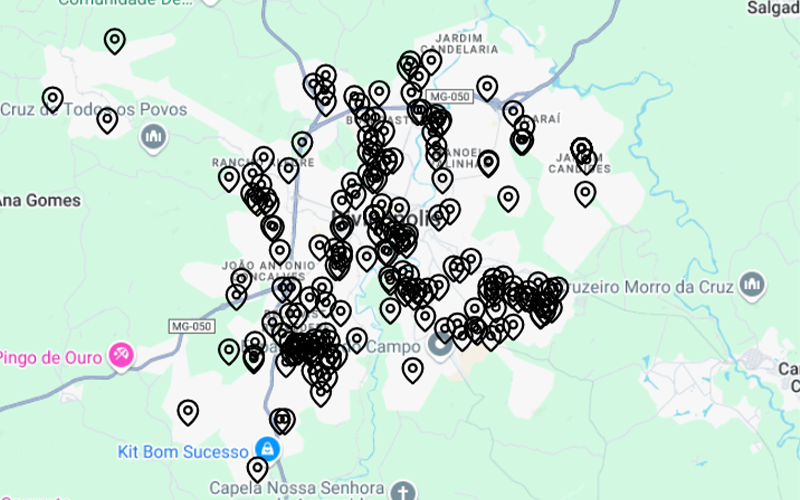
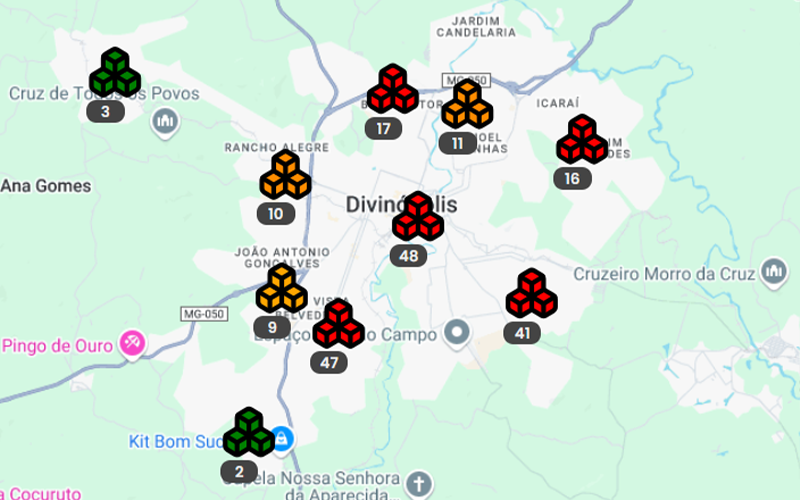
Exemplos de Mapas


Turn data into smart decisions with Crossgeo!
Your ultimate solution for transforming geospatial data into valuable insights. With our intuitive and powerful platform, you can visualize, interpret, and make informed decisions with ease.
GET IN TOUCH!
If you have any questions, please contact us. Our team is available to help and answer any questions you may have.
Phone
+55 31 98386-1852